Key Development
- In Malawi close to 20% of the population is facing hunger until the next harvest in March 2026; state of disaster declared in 11 of 28 districts following drought ; a maize export restriction was enforced; and a US$45 million emergency food funding granted by the World Bank
- The latest reports confirm that La Niña conditions emerged in September 2025 and are expected to last into early 2026. Estimated to be a weak-to-moderate event, it is still likely to bring dry weather conditions to parts of East Africa and above-average rainfalls for Southern Africa as well as flooding
- Maize prices in Nairobi and Dar es Salaam continue at very high levels while there is an overall maize surplus in the region
- Rice prices in East Africa increased to around three times the benchmark Thailand price
- World food prices decline for a second consecutive month.
Zimbabwe addition
- As of this Price Tracker, we are adding Zimbabwe to the markets we track.
- Zimbabwe is a mid-sized maize producer in Southern Africa, generally ranking below South Africa, Zambia and Malawi and often reliant on imports. Maize is the national staple (white maize) and also used in agro-industrial processes (yellow maize), with annual consumption around 2 million tons.
- Production is highly rainfall-dependent and fluctuates sharply between surplus and deficit years, with yields constrained by high input costs such as fertilizer.
- Food security is supported by the Strategic Grain Reserve managed by the Grain Marketing Board (GMB).
- Imports come mainly from South Africa – a GM maize producer – and Zambia, even though Zimbabwe is generally a non-GM country, meaning prices are above and track South Africa prices.
- The El Niño-induced drought of 2023/24 reduced maize output by more than half, prompting a national disaster declaration. Despite this year’s stronger harvest forecast the government lifted the maize import ban
- In parallel, the Government issued rules requiring processors to source at least 40% of their annual supply of grain, oilseed, and related products from local suppliers starting in April 2026.
- Soybean production is limited relative to demand, requiring imports for feed and processing.
- Common beans are widely grown by smallholders and supplemented by imports, while rice is almost entirely imported.
- Fertilizer is fully imported, leaving domestic prices exposed to regional and global market trends.
Maize developments
Figure 1: Maize prices, selected ESA countries
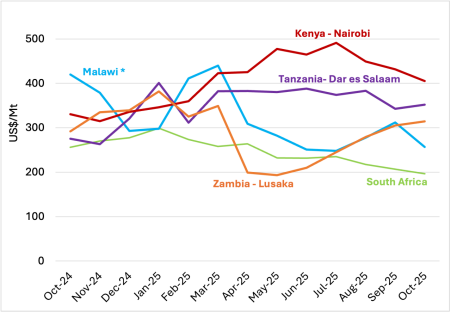
1 – Source: AMO based on price tracker data from multiple sources. *Malawi prices received in local currency and converted using the parallel exchange rate from November 2024 to October 2025
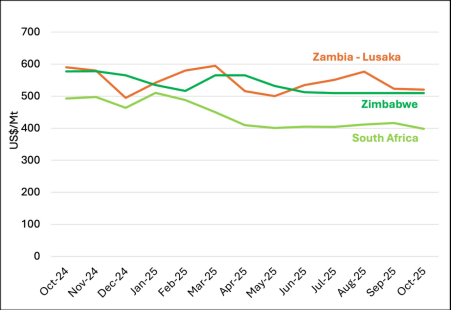
Figure 2: Maize prices, South Africa and Zimbabwe
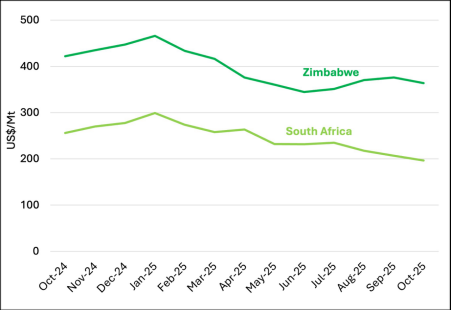
2 – Source: AMO based on price tracker data from multiple sources.
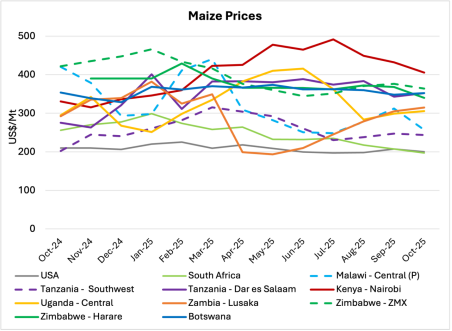
- Zambia maize prices continue to increase, now at US$315/Mt, towards prices in East Africa indicating continued exports given estimated surplus of 1.2 million Mt
- Despite an improved harvest in 2025, Malawi faces maize shortages in the range of approximately 600th Mt to 800th Mt
- The deficit has been attributed to below average production in southern parts of the country, given low rainfall and insufficient supply of fertilizer
- Imports to meet deficit have begun, including from Zambia, while prices at the parallel exchange rate have dropped to US$256/Mt from US$312
- Kenya maize prices declined further to US$405/Mt as the harvest started, yet remain the highest amongst the AMO selected countries and approximately 20% above October 2024
- Tanzania has high prices, around US$350/Mt in Dar es Salaam, while prices in the main south-west producing area are under US$250/Mt with a good harvest and estimated surplus of 1 million Mt available for export.
- The National Food reserve agency NFRA recently announced a tender for 500,000 tonnes of maize for a minimum price of TSh 850 /Kg (US$345/Mt)
- Zimbabwe revised production estimates downwards to 1,800th Mt. This contrasts with the USDA estimate for production of 1,300th MT and for an import need to meet a 700th Mt deficit
- Given South Africa’s bumper harvest and Zimbabwe being open to GM maize, Zimbabwe’s prices are substantially higher than South Africa, with a difference of US$197Mt
Table 1: Maize demand and supply balances, selected ESA countries

3 – Notes: Production/supply estimates not inclusive of carry-over stocks from previous year. Estimates based on AMO calculations drawing on various sources: USDA; Agri Intelligence Africa; FEWS Net; The Malawi Vulnerability Assessment Committee (Mvac)
- With 2025 production in, Zambia has recovered and Tanzania sustained good production meaning surpluses to meet deficits in neighbours
- The substantial regional surplus in East Africa contrasts with the ongoing high prices in Nairobi and Dar es Salaam, around double international prices
- South Africa’s surplus is in line with the norm, meaning prices at export levels, and with exports to Zimbabwe and into deep sea markets
Soybean developments
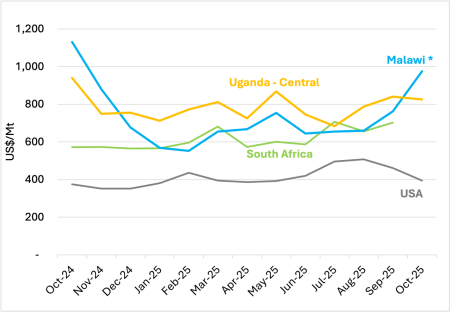
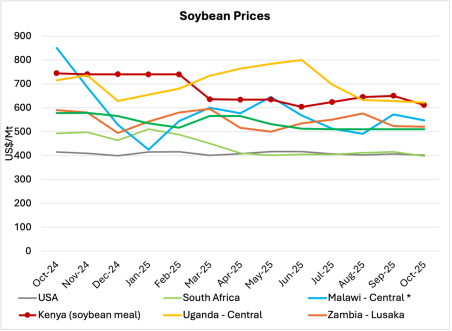
Figure 3: Soybean prices, selected ESA countries
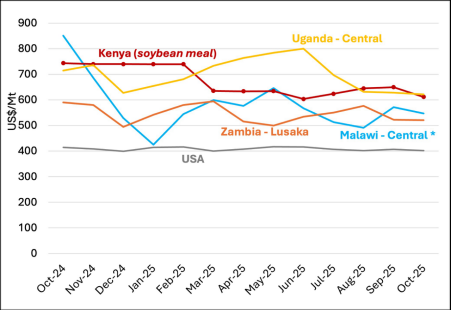
4 – Source: AMO based on price tracker data from multiple sources. *Malawi prices received in local currency and converted using the parallel exchange rate from November 2024 to October 2025, as discussed.
Figure : Soybean prices, Zambia, Zimbabwe and South Africa
5 – Source: AMO based on price tracker data from multiple sources
- Kenyan average soymeal prices dipped slightly in October by 6% to US$612 /Mt versus the previous month
- Uganda prices level out their descent, down 13% since June (US$800/Mt vs US$622/Mt in October)
- Malawi prices (with parallel rates) again above Zambia and the latter very much in line with Zimbabwe (see also chart in appendix )
- South Africa practically equal to USA benchmark
Rice Developments
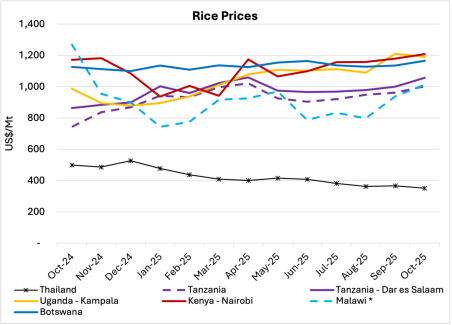
Figure 5: Rice prices, selected ESA countries
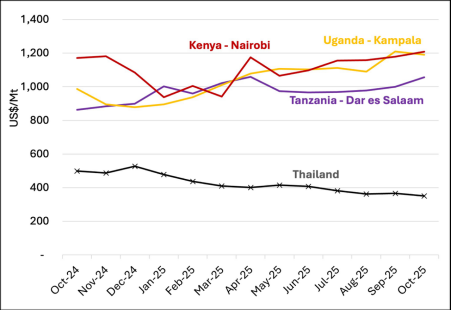
6 – Source: AMO based on price tracker data from multiple sources, Thailand price is from the World Bank.
- International rice prices continue to decrease ahead of the main harvest in main exporting countries while prices in East Africa continue upwards, meaning prices in Nairobi and Kampala are now three times the Thailand price
- Thailand benchmark fell further to US$351/Mt in October
Fertilizer developments
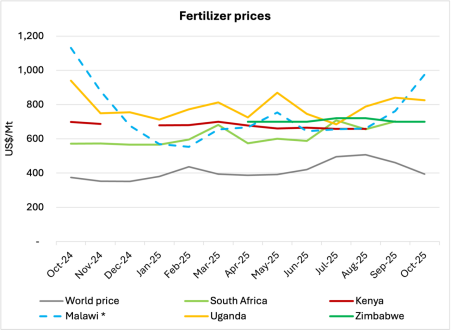
Figure 6: Fertilizer prices, selected ESA countries
7 – Source: Own calculations based on multiple sources; World Bank (world price) and Grain SA (South Africa). * Malawi prices received in local currency and converted using the parallel exchange rate from November 2024, as discussed here.
- International urea prices in October are down 14% compared to September and 22% from their 2025 peak of US$508/MT in August.
- Prices in Uganda and Malawi continue to trend upward however, widening the margin relative to the international benchmark.
Detailed price charts – Selected ESA countries & International Prices
8 – Source: AMO based on price tracker data from multiple sources, * Malawi prices received in local currency and converted using the parallel exchange rate from November 2024 , as discussed
here. South Africa is SA Futures Exchange price; USA is fob prices from SAGIS.
9 – Source: AMO based on price tracker data from multiple sources, * Malawi prices received in local currency and converted using the parallel exchange rate from November 2024, as discussed
here. South Africa is SA Futures Exchange price; USA is fob prices from SAGIS.
10 – Source: AMO based on price tracker data from multiple sources, * Malawi prices received in local currency and converted using the parallel exchange rate from November 2024, as discussed
here. World price is from the World Bank.
11 – Source: Own calculations based on multiple sources; AfricaFertiliser.org, World Bank (world price) and Grain SA (South Africa). Malawi prices received in local currency and converted using the parallel exchange rate from November 2024, as discussed.
Comments are closed for this post.